
Unlock clarity, empower decisions.
Turn scattered data into actionable insight, and drive smarter decisions.
- Brands served
- 12+
- Projects delivered
- 77+
- Capability
- 03/08
Why data analytics & BI?
Because the right decision starts with the right data.
With advanced analytics and tailored dashboards, we turn scattered data into clear, visual insight, so your team moves with confidence and speed.
This service is for you if you want to…
- 01
Predict what’s next
Forecast trends and behaviour with AI.
- 02
Tell stories with data
Turn numbers into clear narratives.
- 03
Integrate your systems
Connect scattered data into one view.
- 04
Equip your executives
Give leaders what matters, fast.
- 05
Monitor performance
Track business KPIs in real time.
From data to decisions.
Connect your sources, find what matters and put insight to work.
01
Discovery & goal alignment
We align on your KPIs, pain points and what success looks like.
Discovery brief, data audit
02
Integration & cleansing
ERP, CRM, IoT and third-party APIs connected, and messy data made usable.
Unified data layer, integration plan
03
Analysis & modelling
Analysts and data scientists uncover trends, patterns and anomalies, from descriptive to predictive.
Insight models, analytics summary
04
Dashboard development
Interactive dashboards tailored to each role, from executives to field operators.
Generative AI dashboards
05
Activation
Insight that gets applied, not just displayed, with recommendations layered in.
Insight decks, alerts, reports
What you’ll walk away with.
07 outcomes
Customer segmentation insights
In-depth analysis of your segments to personalise strategy.
KPI-driven dashboards
Built for teams, executives or operations: the right data at the right time.
Root-cause analysis and trends
Not just what happened, but why, through anomaly detection, drill-downs and cohorts.
Predictive and prescriptive models
AI and ML where it helps, to forecast outcomes and recommend next steps.
Automated reporting
Real-time reports, alerts and visual summaries instead of spreadsheets.
Data-driven recommendations
Actionable strategies to optimise operations and grow.
End-to-end integration
We work with your dev and data teams for seamless, scalable back-end integration.
Related projects.
A few of the brands we’ve lifted with Data Analytics & Business Intelligence.
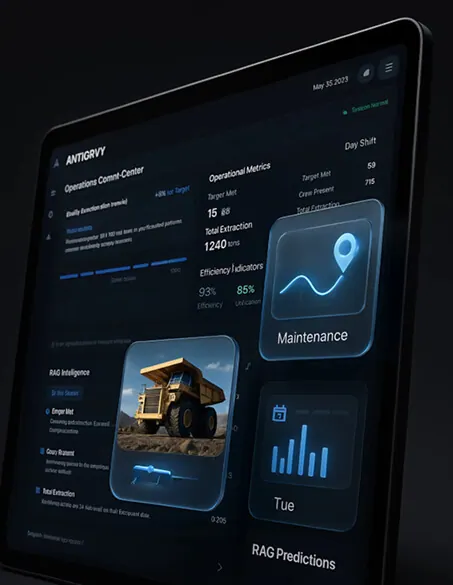
01 Predictive AI Dashboard
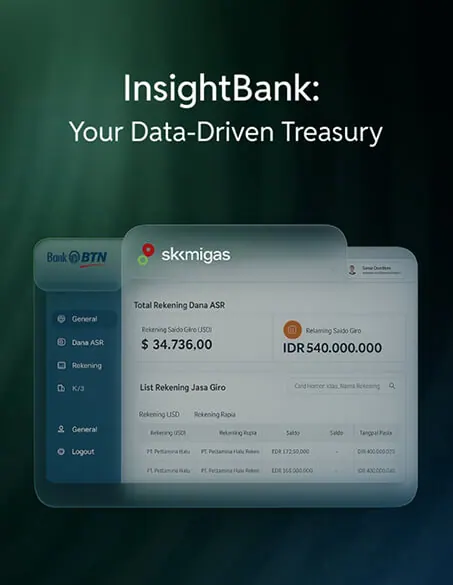
02 SKK Migas Dashboard
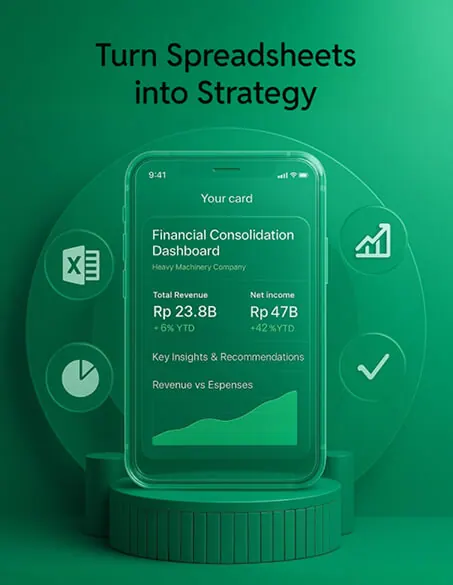
03 Heavy Machinery Analytics
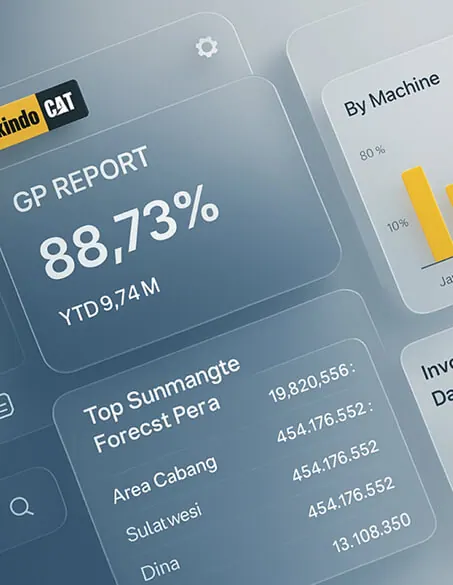
04 Dashboard Development
Questions, answered.
Still wondering about something? Ask us directly.
01What types of data can you analyse?
Customer, sales, web traffic and operational data, among others, from sources such as your CRM, Google Analytics and internal systems.
02Do we need clean data before starting?
No. Cleaning and organising your data is part of our process, so the results are accurate.
03Can you work with our internal data or IT team?
Absolutely. We can work alongside your engineers and analysts, or act as your full analytics partner.
04How long does it take to build a dashboard?
A focused dashboard takes 1 to 2 weeks. Larger BI ecosystems typically take 4 to 6 weeks.
05Can you turn raw Excel or CSV files into dashboards?
Yes. We clean and transform unstructured data into visual dashboards, even when it’s scattered.
06How are your dashboards different from templates?
They’re built around your users and business goals, not just pretty charts.
07Do you offer support after delivery?
Yes, through retainers for dashboard updates, advanced analytics and ongoing insight activation.